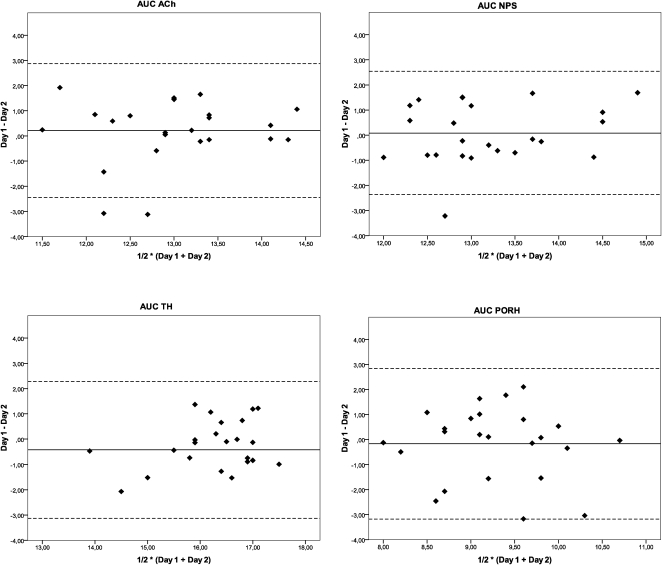
Figure 1.
Bland-Altman plots for the assessment of the day-to-day repeatability of microvascular reactivity measurements obtained one week apart in healthy subjects using laser Doppler perfusion monitoring. The difference in the responses measured on the two days (Day 1– Day 2) is plotted against the average of the responses [½ * (Day 1 + Day 2)]. The solid lines correspond to the mean of the differences, and the dashed lines indicate the 95% limits of agreement for the differences between the days. The values were log-transformed. Ach = acetylcholine, AUC = area under the blood flow/time curve, SNP = sodium nitroprusside, PORH = post-occlusive reactive hyperemia, and TH = thermal hyperemia.

