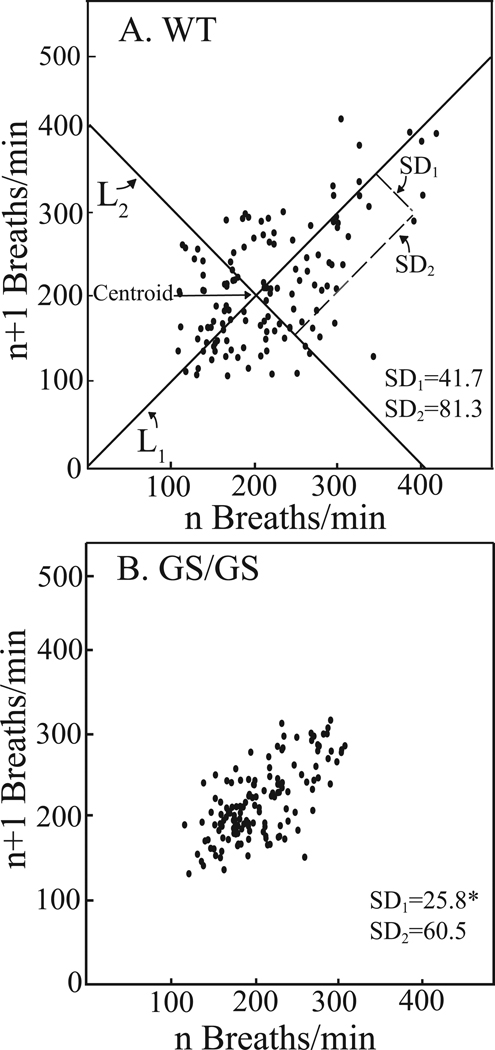
Figure 3.
Poincaré plots illustrating the range of respiratory rates in WT (A) and Gαi2 GS/GS (B) mice during the 1 h recovery period following cessation of isoflurane delivery. Each point represents the mean respiratory rate (n = 3 mice per genotype) of a 5 min segment plotted against the next 5 min segment. The plot was analyzed by determining two standard deviation values: SD1 and SD2 for each data point. SD1 is defined as the dispersion of points perpendicular to the line-of-identity (L1). SD1 is used to analyze short-term variation. For these analyses SD1 corresponds to breath-to-breath variation of the respiratory cycle. The centroid is the point representing the overall mean respiratory rate. SD2 is defined as the dispersion of points along the line-of-identity passing through the centroid. SD2 is also referred to as long-term variation and for these data SD2 characterizes variability in respiratory rate due to genotype. Breath-to-breath respiratory rate of Gαi2 GS/GS mice was significantly (*, p < 0.001) less variable (smaller SD1) than WT mice.

