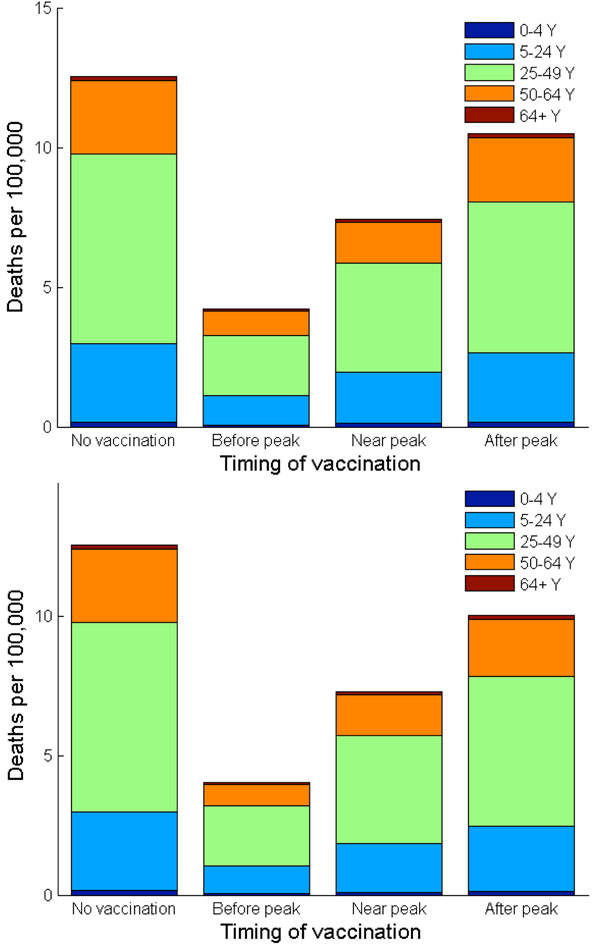
Figure 7.
Deaths per 100,000 when vaccination follows the Nash and utilitarian strategies. The number of deaths per 100,000 is shown in age groups with and without vaccination. (a) Vaccination is implemented according to the Nash strategy at different timing of a pandemic wave, i.e. three weeks before, exactly at, or three weeks after the peak of a pandemic influenza. (b) Vaccination is implemented according to the utilitarian strategy at different timing of a pandemic wave, i.e. three weeks before, exactly at, or three weeks after the peak of a pandemic influenza.

