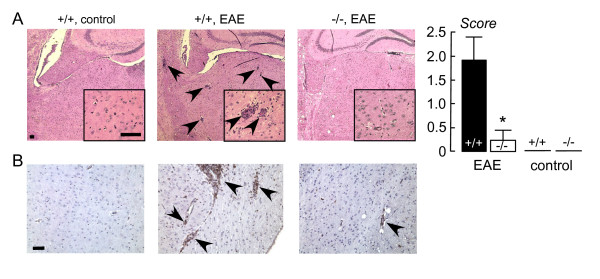
Figure 4.
Brain following EAE induction. A. (left) Representative hematoxylin and eosin stained brain sections from EAE-induced wildtype (+/+) and AQP4 null (-/-) mice, and control (non-MOG-treated) wildtype mice. Arrows denote mononuclear cell infiltrates. All scale bars: 100 μm. (right) Histological score (S.E., p < 0.001). B. CD45 immunohistochemistry. Arrows denote CD45-positive lymphocytes.

