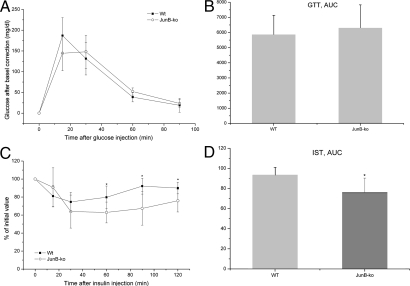
Fig. 2.
JunB-KO mice have elevated insulin sensitivity. A, For the GTT, six WT (■) and four JunB-KO (○) mice at the age of 4 months were fasted for 6 h. Baseline blood samples were then collected by tail bleeding (time zero). Subsequently, the mice received an ip injection of glucose, and additional blood samples were drawn by tail bleeding at 15, 30, 60, and 90 min after injection. Glucose was determined using the Glucometer from Roche. The curve for the GTT was baseline corrected. Statistical significance was determined using the two-tailed Student's t test. B, To examine glucose tolerance of WT (■) and JunB-KO (○) mice, the glucose AUC was calculated after correction for baseline blood glucose concentrations. C, For the IST, six mice from each group were fasted for 4 h, and afterward, 0.5 IU insulin/kg mouse was administered ip. Blood samples were collected by tail bleeding at the time points indicated in the figure. Glucose was determined using the Glucometer from Roche. The curve for the IST was baseline corrected. Statistical significance was determined using the two-tailed Student's t test. *, P < 0.05. D, The insulin sensitivity, the decrease of plasma glucose after injection of insulin, was determined by the glucose AUC calculated after correction for baseline blood glucose concentration. Statistical significance was determined using the two-tailed Student's t test. *, P < 0.05.

