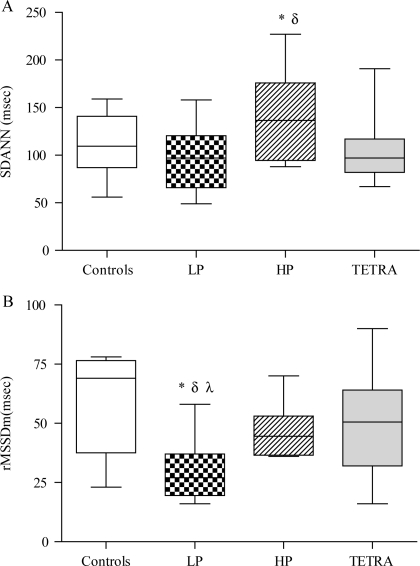
Figure 3.
(A) SDANN (ms) in the control (open box), LP (dotted box), HP (hatched box), and TETRA (gray box). *: P < 0.01 versus LP and TETRA; δ: P < 0.08 versus controls. (B) rMSSD (ms) in the control (open box), LP (dotted box), HP (hatched box), and TETRA (gray box). *: P < 0.01 versus TETRA; δ: P < 0.001 versus controls; λ: P = 0.05 versus HP.

