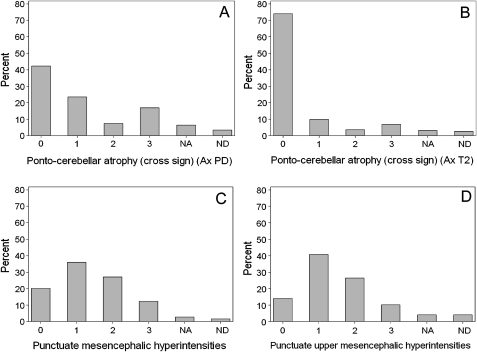
Figure 1.
Distribution of scores (% of overall population) for selected a priori redundant measurements of known (A–B) and new signs (C–D). NA, not assessed due to poor quality of image. ND, not determined due to missing images. (A, B) Ponto-cerebellar atrophy (A) in axial (Ax) proton density (PD) (item 6) and (B) in Ax T2 (item 20), showing similar distribution although better sensitivity of the Ax PD sequence. (C, D) Punctate upper mesencephalic hyperintensities, (C) in Ax T2 (item 18) and (D) in coronal T2 (item 31), showing similar distribution and sensitivity.

