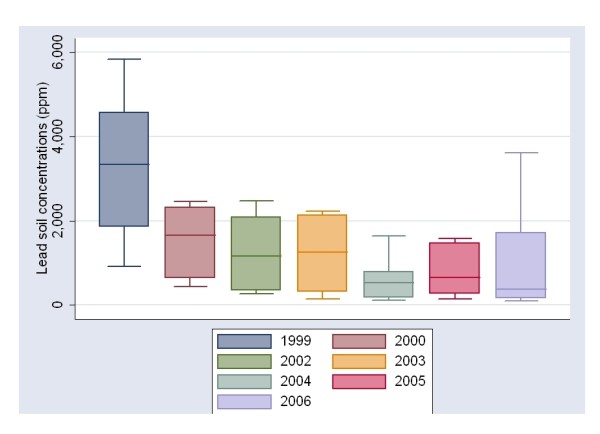
Figure 3.

Box plot representing the timeline of lead concentrations in soil of sites shown in Figure 1 in Torreon Coahuila, except sites 1, 8, and 9. The first bar represents lead in soil concentration in 1999 as a basal time before environmental interventions began. The following bars represent lead in soil concentrations during the time the study was held, from 2002 to 2006. Superfund cleanup goal for lead is of 400 ppm [1].
