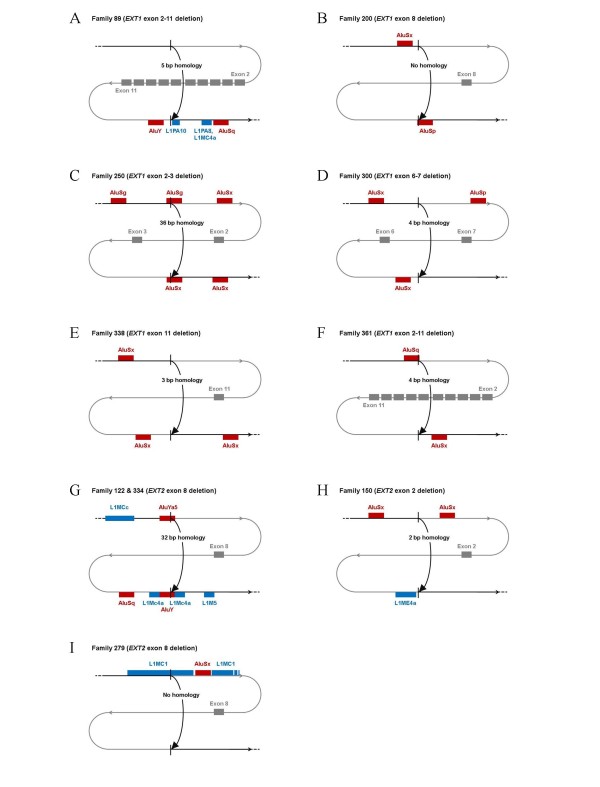
Figure 2.
Schematic representation on all deletions. The curved line represents the DNA sequence, with in black the non-deleted sequence and in grey the deleted part, including the deleted exons that are represented by grey blocks. The upper and lower horizontal lines represent the 20 kb regions around each deletion breakpoint and are to scale. The middle line, including the deleted exons, is not to scale. Vertical black lines point at the deletion breakpoints. Alu-elements are indicated by red bars, LINE1-elements by blue bars. Sequence homology at the deletions breakpoints is mentioned in the arrow, representing the deletion. A.) Family 89 (EXT1 exon 2-11 deletion), B.) Family 200 (EXT1 exon 8 deletion), C.) Family 250 (EXT1 exon 2-3 deletion), D.) Family 300 (EXT1 exon 6-7 deletion), E.) Family 338 (EXT1 exon 11 deletion), F.) Family 361 (EXT1 exon 2-11 deletion), G.) Families 122 & 334 (EXT2 exon 8 deletion), H.) Family 150 (EXT2 exon 2 deletion), I.) Family 279 (EXT2 exon 8 deletion).

