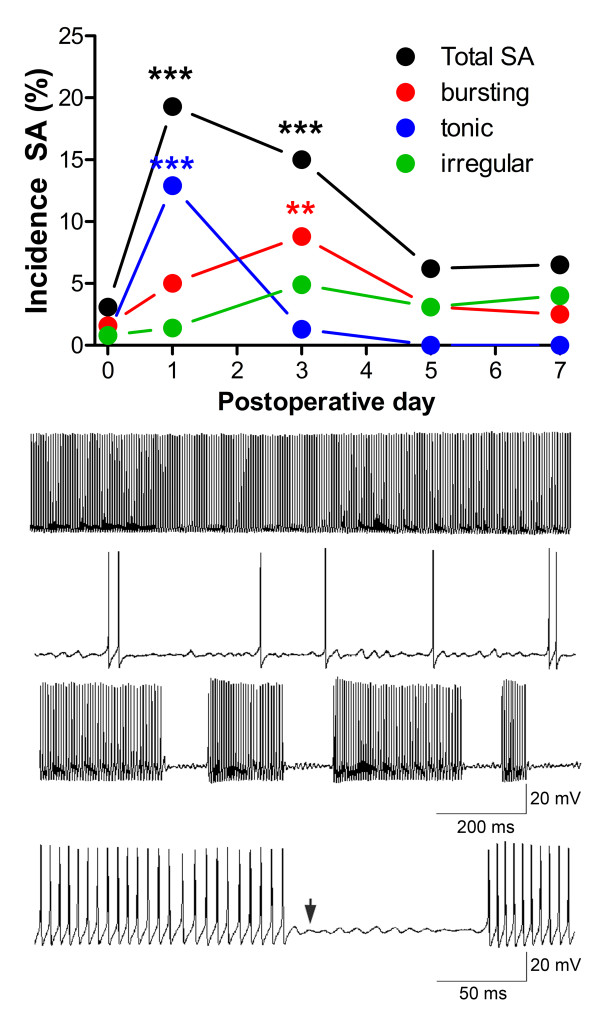
Figure 3.
Overall incidence of spontaneous activity ("Total SA") and of each subtype vs. time after spinal nerve ligation. *, significantly different from control (POD 0), Fishers exact test. N = 149 to 255 cells per group, with a minimum of 3 different animals per group, for this and Figures 4 and 5. Bottom: examples of tonic (top), irregular (second) and bursting (third) activity. The bursting activity has been expanded to show the subthreshold oscillations observed between bursts (bottom trace).

