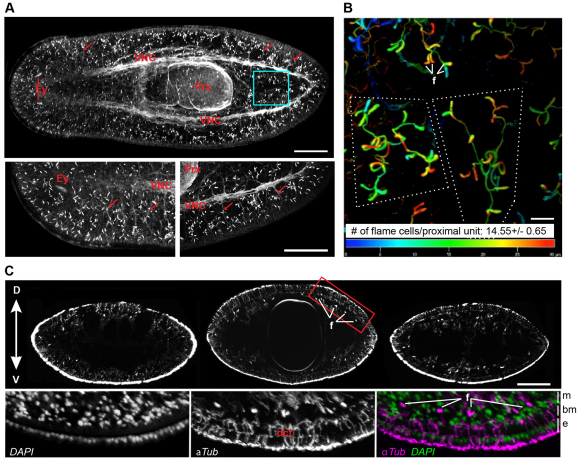
Fig. 1.
Distribution of protonephridia. (A) Whole-mount α-Tubulin antibody staining. Magnified planarian head and tail regions are shown to the lower left and right, respectively. Flame cells appear as brightly stained club-shaped structures. Other anatomical features labeled by α-Tubulin staining are the ventral nerve cord (VNC), pharynx (Prx), eye cups (Ey) and peripheral nerves (arrows indicate examples). Images are maximum projections of confocal z-sections. The boxed region is magnified in B. (B) Depth-coded maximum projection of proximal units in the tail. Superficial structures appear in red, structures deep in the tissue as blue. Dotted lines outline single protonephridial units. f, examples of flame cells. (C) Transverse sections (top row) of α-Tubulin-stained whole-mount animals at the level of the photoreceptors (left), pharynx (center) and half-way between pharynx and tail tip (right). Flame cells (f) appear as bright dots. The boxed region is magnified beneath, showing nuclei (DAPI staining, left), α-Tubulin (center) and merge (right). e, surface epithelium; bm, basement membrane; m, mesenchyme; dct, non-protonephridial ductules of mucus-secreting cells. D, dorsal; V, ventral. Scale bars: 200 μm in A,C; 20 μm in B.

