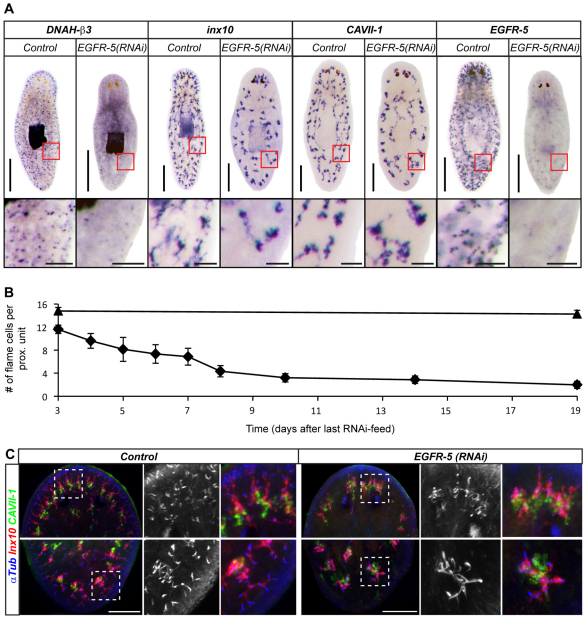
Fig. 7.
EGFR-5(RNAi) phenotype ontogeny in intact animals. (A) Planarian protonephridial marker gene expression in control and EGFR-5(RNAi) animals 14 days after last RNAi feed. Each pair was developed under identical conditions. The boxed regions are magnified beneath. (B) Timecourse quantification of average flame cell numbers per proximal unit. Diamonds, EGFR-5(RNAi) animals; triangles, controls. Flame cells were counted in confocal z-stacks of α-Tubulin/DNAH-β3 double-labeled whole-mount animals. Three proximal units in five animals were scored for each time point. Error bars represent s.e.m. (C) Morphological defects of protonephridia in EGFR-5(RNAi) animals as compared with control 14-days after the last RNAi feed. Head (top row) and tail (bottom row) of representative animals are shown; magnifications show the boxed region from the respective overview images. Monochrome shows α-Tubulin staining alone. Images are maximum projections of confocal z-sections. Scale bars: 500 μm in A, top; 100 μm in C and in A, bottom.

