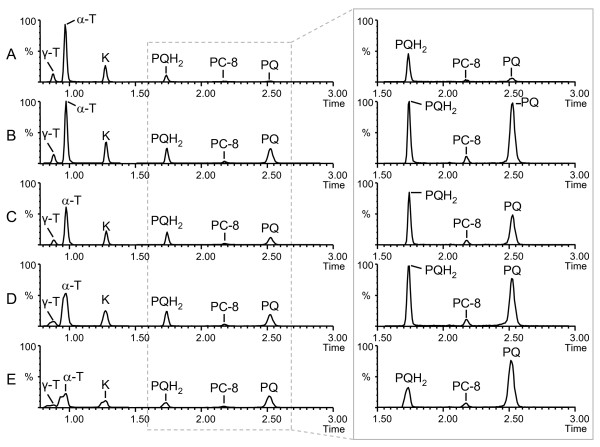
Figure 5.
Extracted ion chromatograms illustrating the influence of the five extraction solvents on the chromatographic performance. A. MeOH 100%. B. CHCl3/MeOH (30:70, v/v). C. IPA. D. THF. E. EtAc. Plants exposed to high light were pooled and extracted using the indicated solvents. 5 μL was injected. Inset on the right: zoom on the peaks corresponding to PQ/PQH2 and PC-8. γ-T, γ-tocopherol; α-T, α-tocopherol; K, phylloquinone; PC-8, plastochromanol-8; PQ: plastoquinone-9 (oxidized); PQH2: plastoquinone-9 (reduced).

