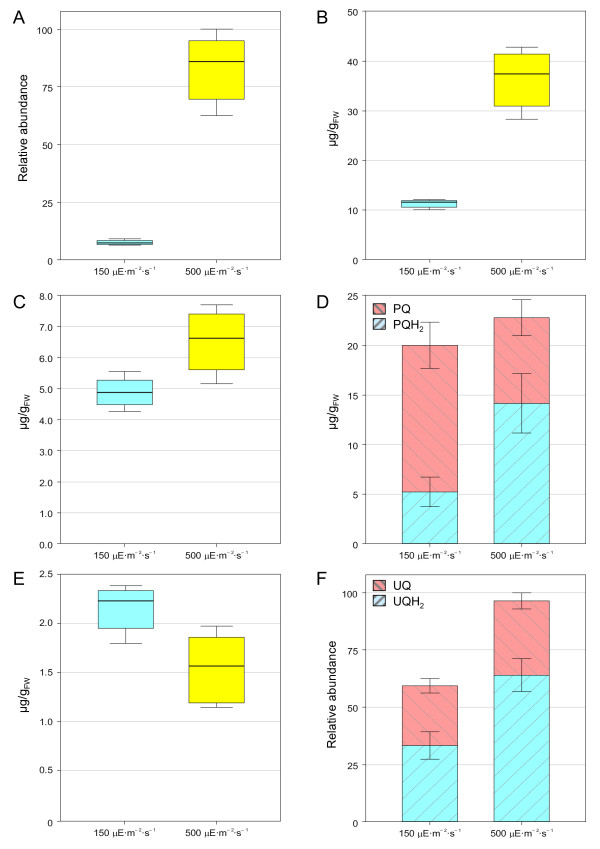
Figure 6.
Effect of HL exposure on the total leaf content of prenylquinones. A. γ-tocopherol. B. α-tocopherol. C. Phylloquinone. D. Plastoquinone-9, oxidized (PQ) and reduced (PQH2) forms. E. Plastochromanol-8. F. Ubiquinone-9, oxidized (UQ) and reduced (UQH2) forms. Plants exposed to normal (150 μE × m-2 × s-1) or high (500 μE × m-2 × s-1) light intensities were extracted using THF. Data are from 4 biological replicates (± SD). For PQ-9 (D) and UQ-9 (F) the redox state of the total leaf pool was taken into account.

