
Figure 9.
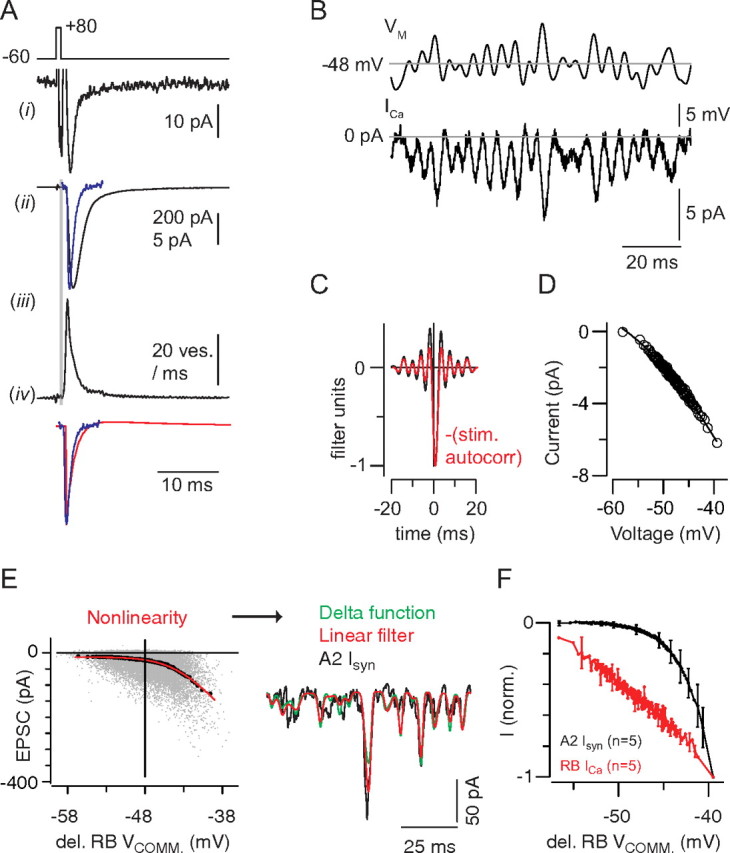
A, A Ca tail current (i) evoked by a 1 ms step from −60 to +80 mV evokes a large, fast EPSC (ii, black trace) that is slower than a quantal miniature EPSC (ii, blue trace) because of the asynchrony inherent in the release process. The extended time course of release is illustrated by deconvolving the miniature EPSC from the evoked response (iii). The gray area highlights the synaptic delay. The waveform of the quantal miniature EPSC (blue) resembles strongly the DOE (black) approximating the true linear filter of the synapse (iv). B, The Ca current elicited by the quasi-white noise stimulus. C, The linear filter exhibits a delay of ∼0.8 ms because of the time required for channel activation (black). In red, The autocorrelation of the stimulus, shifted by +0.8 ms. D, For the recording illustrated, the relationship between Ca current and voltage (delayed by 0.8 ms) was relatively linear. E, The linear prediction is generated by convolving the stimulus with a delayed Dirac delta function, in effect time-shifting (delaying) the stimulus by a constant value. The nonlinearity is represented as a function of the delayed stimulus, and the predicted output generated here (green) is almost identical with that derived from the conventional L-N analysis (B) (red; r2 = 0.55 ± 0.06; n = 5 recorded pairs). F, A comparison of the Ca current and postsynaptic current nonlinearities averaged from n = 5 recordings in each case. Error bars are ±SD.