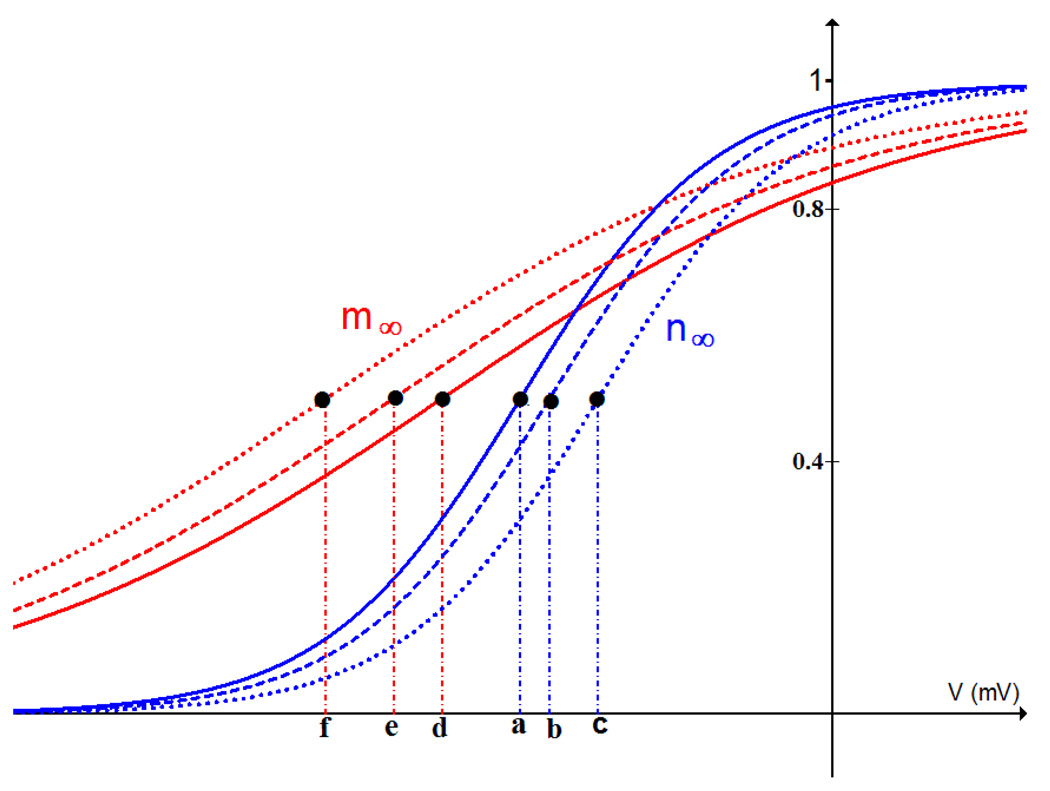
Figure 3.
Steady state functions for the K+ current activation variable n (the n∞ (V) curve, blue) and the Ca2+ current activation variable m (the m∞ curve, red). When υn is increased from −16 mV (point a) to −14.5 mV (point b) or −12 mV (point c), the n∞ curve shifts to the right. This makes the delayed rectifier channels activate at higher voltages. When υm is decreased from −20 mV (point d) to −22.5 mV (point e) or −26 mV (point f), the m∞ curve shifts to the left. This makes the Ca2+ channels activate at lower voltages. When the m∞ and n∞ curves are sufficiently far apart, pseudo-plateau bursting is produced.

