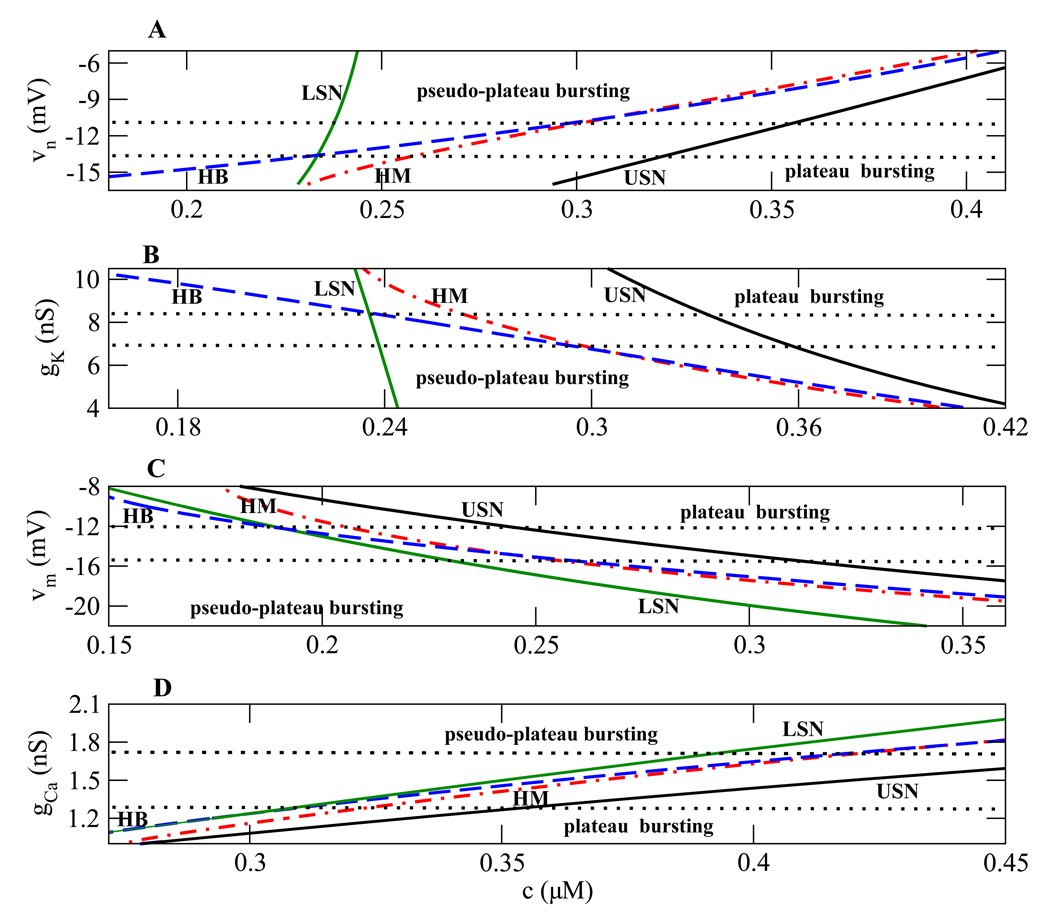
Figure 9.
Two-parameter bifurcation diagrams for a model of the pituitary lactotroph illustrating regions of plateau and pseudo-plateau bursting. (A), (B) Using the parameter values given in Table 2. (C) Using gA = 4 nS, τh = 20 ms and λ = 1.2. (D) Using υm = −27 mV, gK = 7.2 nS, gA = 2.5 nS, τh = 20 ms and λ = 1.2.

