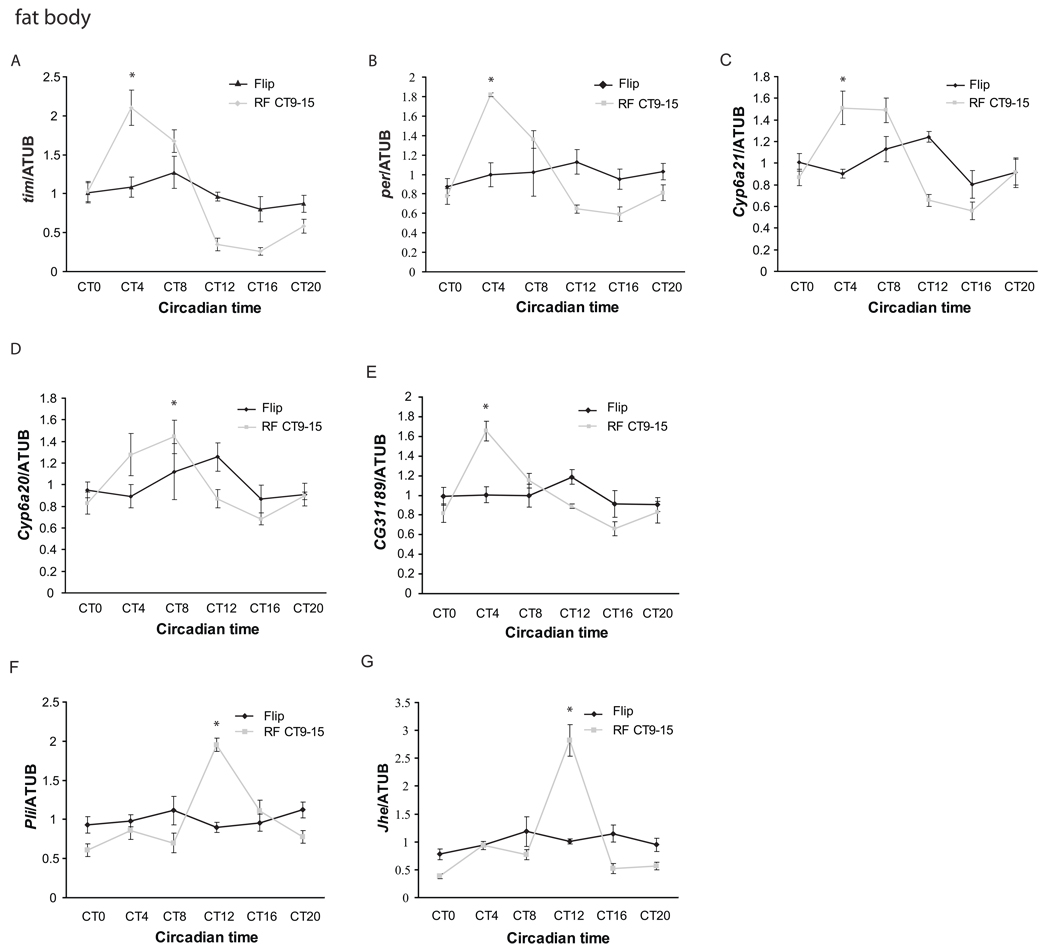
Figure 2. Restricted feeding between CT9 and CT15 drives rhythmic expression of clock genes and clock-regulated genes in the Drosophila fat body.
Quantitative PCR was performed to assay expression of seven cyclically expressed genes at different times of day in the fat body (A–G) of flies maintained on ad lib food (red) or restricted to food between CT9 and CT15 (black). Flies were transferred to a 1% agar vial from a normal food vial on day 1 in DD. Restricted feeding was started on day 2 and continued until day 6 at which point the flies were collected. Of the seven genes assayed - tim, per, cyp6a21, cyp6a20, CG31189, Jhe, and pli –all except per and CG31189 were also assayed in the brain. Expression values are normalized to α-tubulin. Each experiment was repeated at least three times, and the error bars represent S.E.M. Asterisks denote the time of peak expression of genes (p<0.05 compared to the trough point by two-tailed Student’s t-test with unequal variance) in flies that underwent restricted feeding. The cycling was also independently verified by ANOVA.

