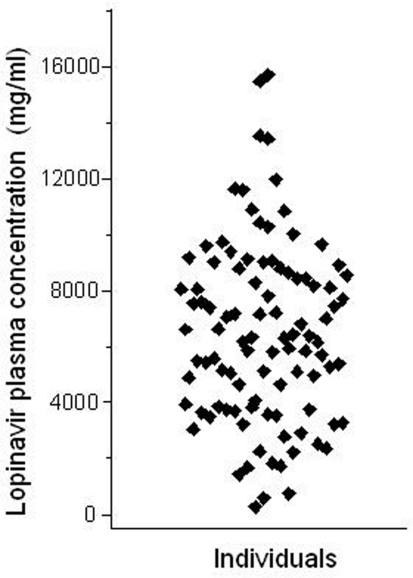
Figure 3.
Intra-individual variability of lopinavir pharmacokinetics. The plot shows the trough (pre-dose) concentration of lopinavir in the plasma of 99 HIV-infected males, under stable HAART treatment including two daily doses of lopinavir (400;mg) and ritonavir (100;mg). Each data point corresponds to one individual. Data from Estrela et al. (2009).

