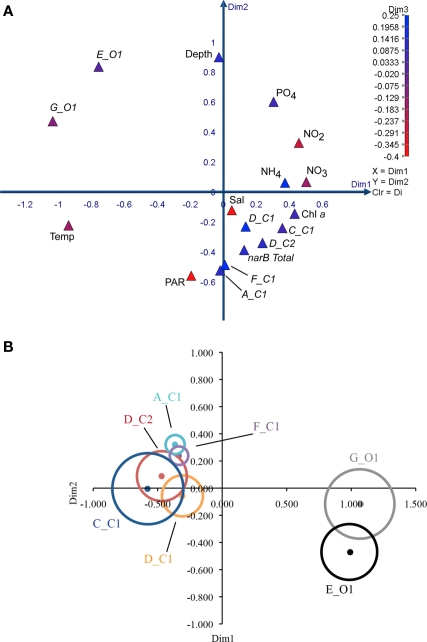
Figure 9.
Multi-dimensional scaling plots of environmental variables and narB subgroup abundances from CN207 samples. Spearman similarity matrices were used to construct the MDS plots. All data used is from the DCM and above, and were log (x + 1) transformed before any analysis. narB subgroup abundance variables are italicized while environmental variables are not. (A) 3D plot of environmental and abundance variables, with the third dimension being represented by color (Kruskal's stress = 0.08). (B) 2D MDS bubble plot of narB subgroup abundances (dots) and their respective correlation coefficients in relation to nitrate (bubbles; Kruskal's stress = 0.04). A Spearman similarity matrix that contained only subgroup abundance data [same as in 9(A)] was used to construct the plot. Bubbles are scaled so that their width equates to the Spearman correlation coefficient value between the abundance of the respective subgroup and nitrate. All correlation coefficient values were significant (p < 0.05) except for subgroups A_C1 and F_C1 (small bubbles). Colored bubbles represent positive coefficients and grayscale bubbles are for negative values. The width of the largest bubble (C_C1) equates to 0.68, while the smallest bubbles equate to ∼0.18.

