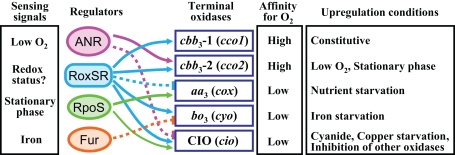
Figure 2.
Schematic model of the regulatory network controlling the multiple terminal oxidases in P. aeruginosa. The sensing signals for the regulators are shown in the left column. Affinity for oxygen and upregulation conditions of the terminal oxidases are shown in the right columns. Activation is indicated by arrows. Inhibition is indicated by bars with dotted lines.

