
Figure 6.
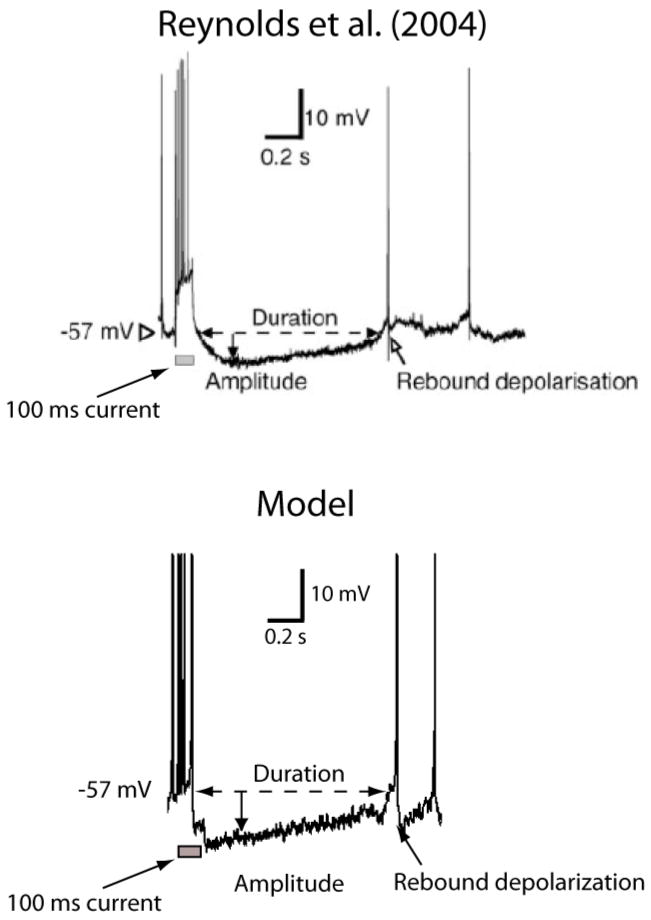
Patch-clamp recording from the TAN of a rat (top panel; from Reynolds et al., 2004) and simulated responses of the Ashby and Crossley (2010) TAN model (bottom panel) during a patch clamp experiment when positive current is injected into the cell for 100 ms (denoted by the solid gray rectangle).