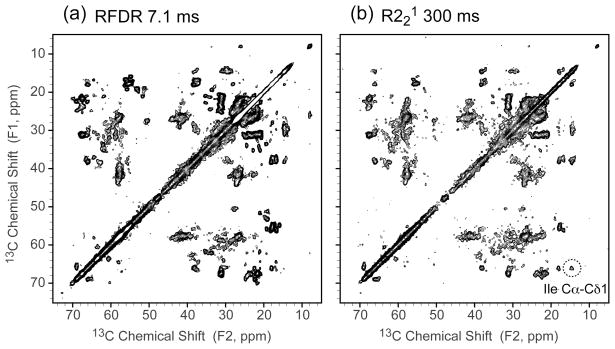
Figure 4.
2D 13C-13C correlation spectra of DsbB/CuDMPE-DTPA (a) with RFDR 7.1 ms mixing and (b) with R221 300 ms mixing under 36 kHz MAS (B0 = 11.7 T, Tsample = −15 °C, recycle delay 0.3 s, maximum t1 = 15.36 ms, maximum t2 = 20.48 ms). The dashed circle indicates Ile Cα-Cδ1 correlations that are more prominent in R221 300 ms mixing. Both data were processed with 30 and 30 Hz net line broadening in each dimension and plotted at the same contour levels, with the lowest contour at 5σ.

