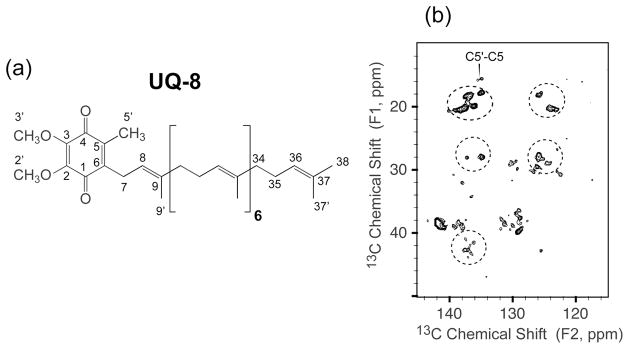
Figure 5.
(a) UQ-8 structure with IUPAC nomenclature. (b) Expansion of UQ-8 region of 2D 13C-13C correlation spectra of DsbB/CuDMPE-DTPA under 36 kHz MAS with RFDR 7.1 ms mixing (B0 = 11.7 T, Tsample = −15 °C, recycle delay 0.3 s, maximum t1 = 15.36 ms, maximum t2 = 20.48 ms). The UQ-8 C5′-C5 peak was marked and dashed circles highlighted the UQ-8 correlations. The data were processed with 30 and 30 Hz net line broadening in each dimension.

