Figure 3.
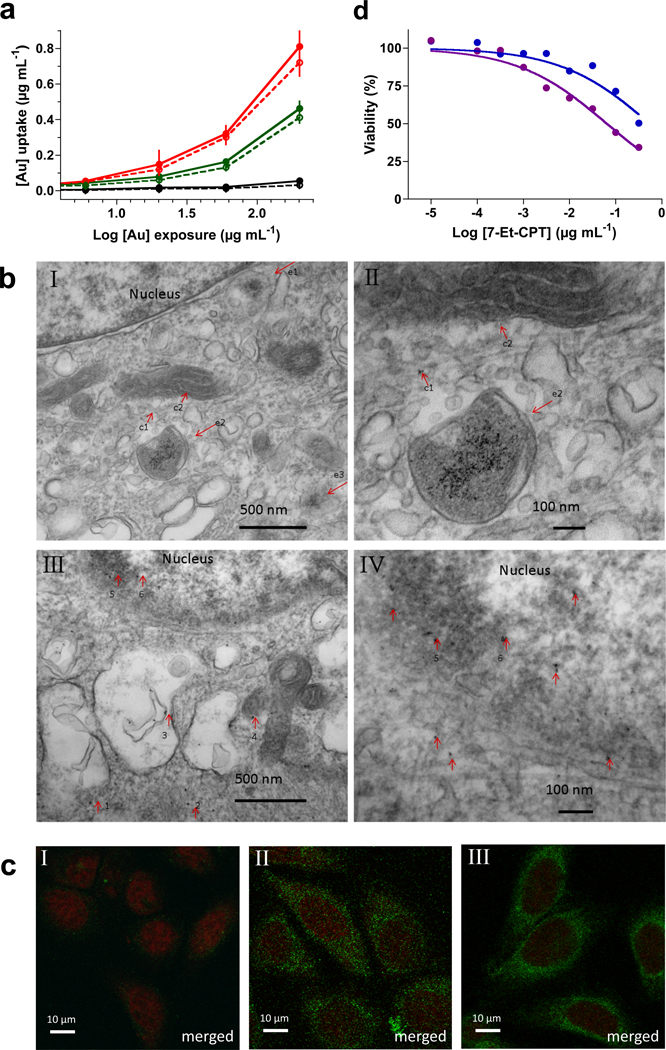
Cellular uptake and cytotoxicity of nanoparticles. HeLa cells were exposed to D (black), E (red) or F (green) at the indicated concentrations of gold for 5 h. After cells were washed and lysed, fluorescence (absorbance 485 nm, emission 520 nm) was measured (solid lines/closed symbols). Samples assessed for internalization were first treated with trypsin before washing and cells lyses (dashed lines/open symbols). Calibration curves of the corresponding Alexa Fluor 488-conjugated gold particles were used to calculate uptake (Figure S19, Supporting Information). Data represent mean values ± s.d. (n=3) (a). TEM images of representative sections of HeLa cells that were incubated with E (I, II) and F (III, IV) at 100 µg mL−1 gold for 10 h. The endosome is denoted as e and the cytosol as c. Images I and II indicate that nanoparticles E are internalized by cells and the Au NPs were mainly confined in endosomes (arrows e1–3). Only, a very small number of Au NPs were dispersed in the cytosol (arrows c1–3). Images III and IV show that nanoparticles F are dispersed in the cytosol (arrow 1), filaments (arrow 2), lysosomes (arrow 3) and mitochondrion (arrow 4), and were especially found around the nuclear membrane (arrow 5) and a few inside the nucleus (arrow 6) (b). Fluorescence images of cells incubated with gold particle preparations D, E and F. HeLa cells were exposed to D (I), E (II) and F (III) at 30 µg mL−1 gold for 10 h and, after washing, fixing, and staining for the nucleus with the far-red-fluorescent dye TO-PRO-3 iodide, imaged. Merged indicate that the images of cells labeled with Alexa Fluor (488 nm) and TO-PRO iodide (633 nm) are merged and are shown in green and red, respectively (c). Cytotoxicity assessment of 7-Et-CPT-loaded gold nanoparticles B and G. MCF-7 cells were incubated with 7-Et-CPT-loaded gold nanoparticles B (blue) and G (purple) at the indicated concentrations of 7-Et-CPT for 8 h. After replacement of the medium, incubation was continued for 3 days. Cell viability values were normalized for untreated control cells (100%). Data represent mean values ± s.d. (n=3) (d).

