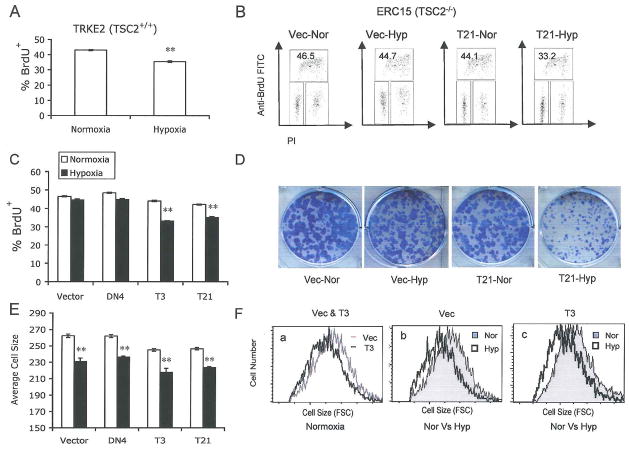
Figure 6. TSC2 mutation enhances cell proliferation under low O2 by abolishing hypoxia-induced cell cycle arrest.
(A–C) Serum replete TRKE2 and ERC15 cells were exposed to 21% or 0.5% O2 for 24 hr. Cell cycle profile was determined by BrdU/PI staining and analyzed by flow cytometry.
(A) Hypoxia suppresses S-phase entry in TSC2+/+ TRKE2 cells. The graph shows the percentages of BrdU+ TRKE2 cells under normoxic and hypoxic conditions.
(B) Representative FACS plots for TSC2−/− ERC15 cells transfected with vector (Vec) or wild-type TSC2 (T21).
(C) Quantification of BrdU+ cells for ERC15 clones.
(D–F) ERC15 cell clones were grown in the presence of 10% FBS under 21 % or 0.5% O2 for 7 days.
(D) ERC15 colonies were stained using 0.2% crystal violet.
(E) Quantifications of size of ERC15 cells subjected to normoxic (light bars) and hypoxic (dark bars) conditions. Cell size was determined by forward scatter (FSC) for cells in G1 phase of the cell cycle.
(F) Representative FACS plots for cell size measurements described in panel E. ERC15 cells (Vec and T3) treated under normoxia (a); Representative plots for Vec (b) and T3 cells (c) under normoxic and hypoxic conditions.

