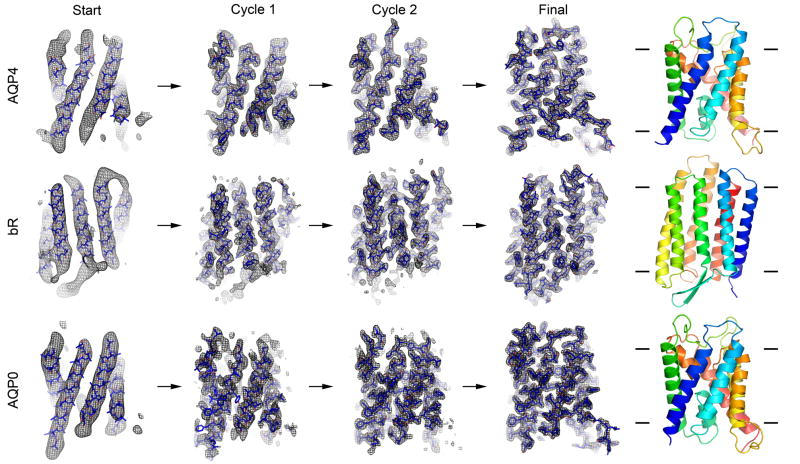
Figure 3. Fragment-based phase extension of AQP4, bR and AQP0 to 3.2Å, 3.0 and 1.9Å resolution, respectively.
(Start) Image phase data to 6Å resolution served as the starting point for fragment positioning. (Cycles 1 and 2) Close up views of the σA-weight 2Fo-Fc density maps (with the corresponding models overlaid) at the end of cycles 1 and 2 of the phase extension procedures, respectively. (Final) Close up view of the final structure of AQP4, bR and AQP0 with the density from phases extended to 3.2Å, 3.0 and 1.9Å resolution, respectively. As the phases improved, more and more densities for amino acid residues became apparent and loops connecting α-helices became visible. The ribbon diagrams represent the final structures as indicated and colored in spectrum from blue to red corresponding to the N- to C-termini, respectively.

