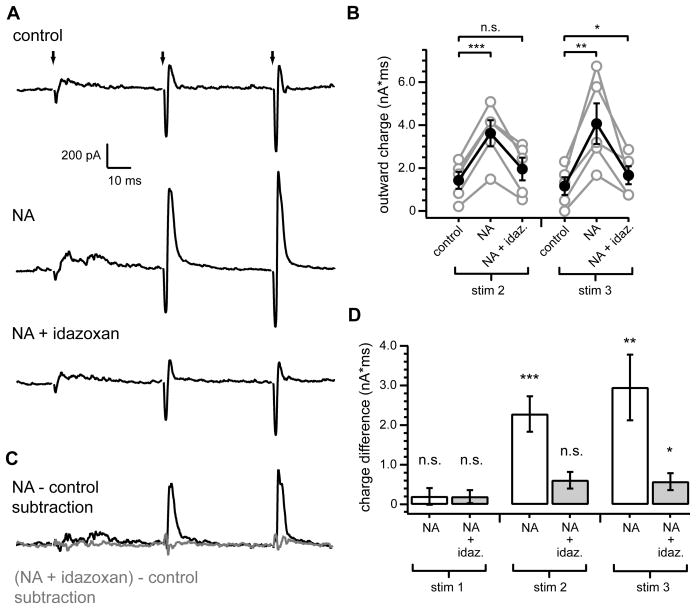
Figure 6. Noradrenergic enhancement of feed-forward inhibition requires α2 adrenergic receptors.
(A) Top, example fusiform cell averaged response to train stimuli of parallel fiber inputs (3 stim at 20 Hz) (identical experimental configuration to Figure 1). Middle, response of same cell to identical stimulus, but in NA (10 μM). Bottom, subsequent response of same cell to same stimulus, with co-application of idazoxan (1 μM) and NA). (B) Summary of outward charge measurements for second and third stimuli. Gray circles are data from individual cells. Filled black circles with error bars show mean ± SEM. Outward charge after second stimulus was significantly increased from control in NA (***p< 0.001), but not in NA + idazoxan (p=0.1). Outward charge after third stimulus was significantly increased from control in NA (**p<0.01) and slightly, but significantly, increased in NA + idazoxan (*p=0.047), n=5.
(C) Subtraction of response in control (A, top) from response in NA (A, middle) is shown in black. Subtraction of response in control (A, top) from response in NA+ idazoxan (A, bottom) is shown in gray.
(D) Summary of mean total charge measurements after each stimulus (20 ms window) from subtracted currents as shown in E. Charge difference measurements are significantly different from 0 pA*ms for stim2 NA (***p<0.002) and stim3 NA (**p<0.01) and NA + idazoxan (*p<0.05), but not for stim1 NA (p=0.46) and NA + idazoxan (p=0.29) or stim2 NA + idazoxan (p=0.053), one sample t-test, n=5.
Stimulus artifacts in (A) were blanked for clarity. Current traces are averages from 20 consecutive sweeps. Scale bars apply to all current traces.

