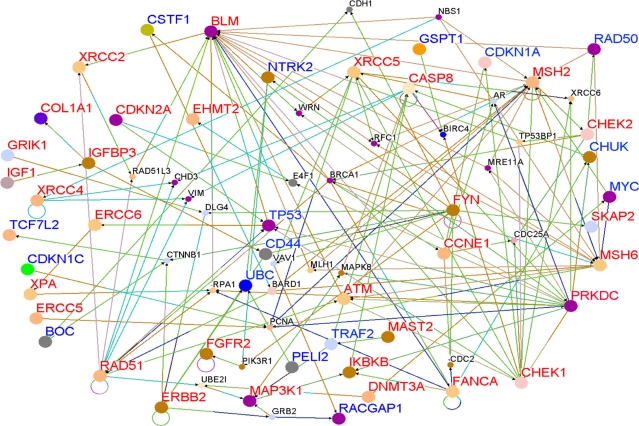
Figure 5.
Gene interaction networks for genes containing SNPs (Red) and novel genes (Blue) identified using a threshold (P < 10−6) and other functionally related genes (in black) correlated with candidate genes and novel genes in the Caucasian population only. The size of the nodes: Large indicate SNP-containing and Novel genes identified through differential expression analysis, whereas small nodes indicate genes experimentally confirmed in the literature and through co-expression analysis that are functionally related and interact with SNP-containing and novel genes.

