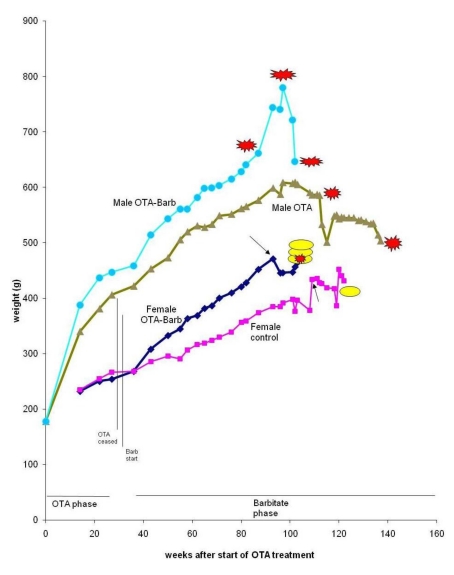
Figure 2.
Mean weight of groups of male and female rats throughout life from commencement of the experiment. Parallel vertical lines show a 3-week untreated period separating the initial period of exposure to dietary OTA from subsequent treatment with sodium barbitate. Red stars represent discovery of renal tumours. Yellow oval shapes indicate euthanized rats with mammary tumours.

