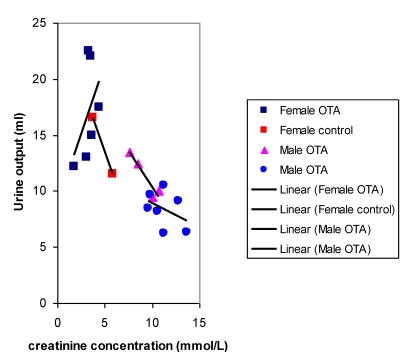
Figure 5.
Comparative relationships between fitted curves for 18 hour urine output and creatinine concentration after 36 weeks of dietary OTA in male and female rats. Data from two measurements in males at an interval of one week overlap in a common inter-relationship. In contrast, data for females treated with OTA lack this correlation while it is present in that for untreated female controls.

