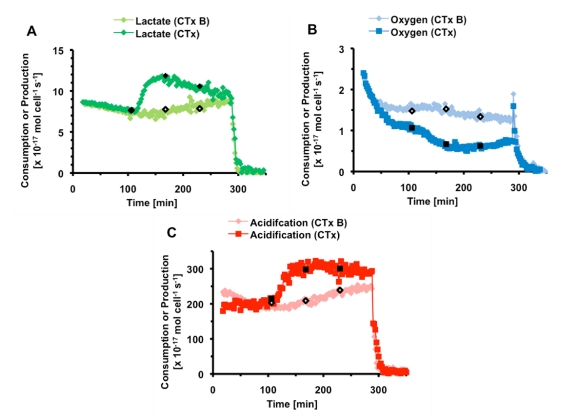
Figure 6.
Average metabolic responses of PC-12 cells exposed to either 100 nM CTx or 500 nM CTxB subunit. Cell necrosis is triggered at 300 minutes. (a) Lactate production. The average of four chambers ( ) treated with three 2-minute pulse of 500 nM CTxB (◊). The other trace is the average of four chambers (
 ) treated with three 2-minute pulse of 100 nM CTx (♦). (b) Oxygen Consumption. The average of four chambers (
 ) treated with three 2-minute pulse of 500 nM CTxB (◊). The other trace is the average of three chambers (
 ) treated with three 2-minute pulse of 100 nM CTx (■). (c) Acid production. The average of four chambers (
 ) treated with three 2-minute pulse of 500 nM CTxB (◊). The other trace is the average of four chambers (
 ) treated with three 2-minute pulse of 100 nM CTx (■).

