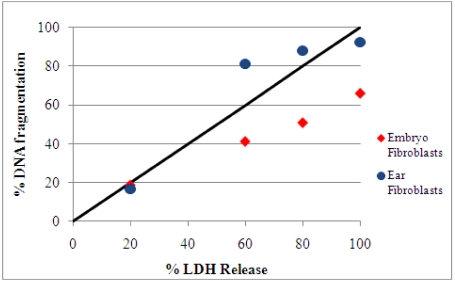
Figure 3.
Comparison of DNA fragmentation and LDH release in fibroblasts cultures after 24 h of exposure to 0.6, 2.5, 5, or 10 μg/mL OTA. The solid line indicates an equal percentage of DNA fragmentation and LDH release. During necrosis, the experimental values should be close to this line [25]. In the presence of the selected OTA concentrations, in both cell cultures the experimental values indicated proportional changes in DNA fragmentation and LDH release.

