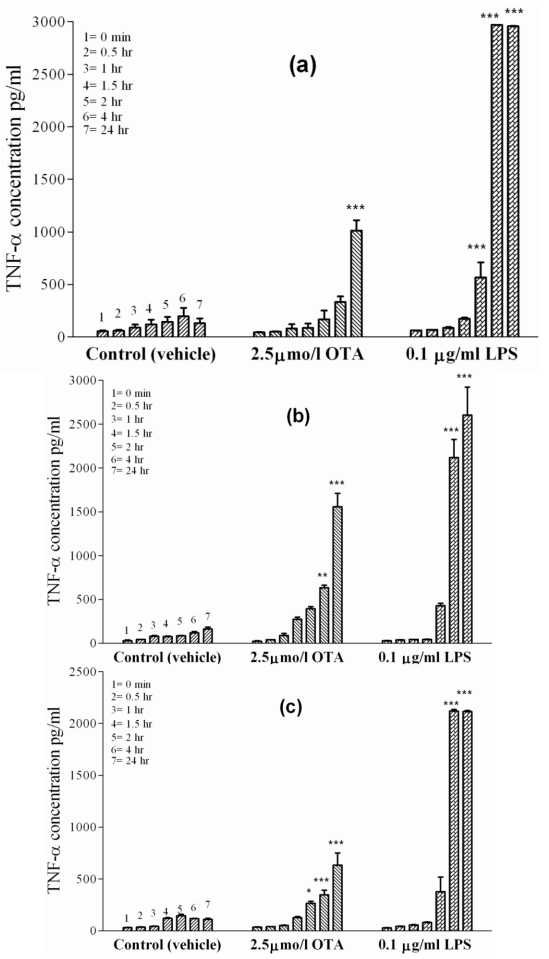
Figure 2.
TNF-α concentrations were measured in incubation media of isolated cells in cell culture at 0, 0.5, 1, 1.5, 2, 4 and 24 h indicated by single columns 1–7, respectively. The cells were exposed to vehicle ( ), 2.5 µmol/L OTA (
 ) or 0.1 µg/mL LPS (
 ). Panel (a) Kupffer cells. Panel (b) Peritoneal macrophages. Panel (c) J774A.1 cell line. OTA and LPS were added 1 h after zero samples (see Materials and Methods). Values represent the mean ± SEM of three cell preparations for each group (* P < 0.05; ** P < 0.01; *** P < 0.001) (TNF-α release from primary macrophages and macrophages like cells).

