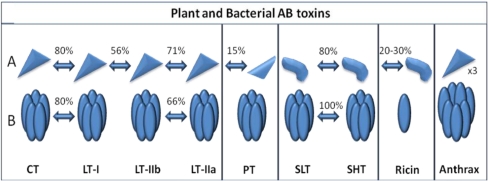
Figure 2.
Pictorial representation of structural and amino acid sequence homologies among bacterial and plant AB enterotoxins. (A) The top panel represents the catalytic (toxic) A subunit proteins; (B) The bottom panel represents the membrane binding B subunit proteins. Approximate values for amino acid sequence homologies observed among the AB subunits depicted from different enterotoxins are provided as percentages. Enterotoxin subunits with no arrows between them share little to no amino acid or structural homologies [19].

