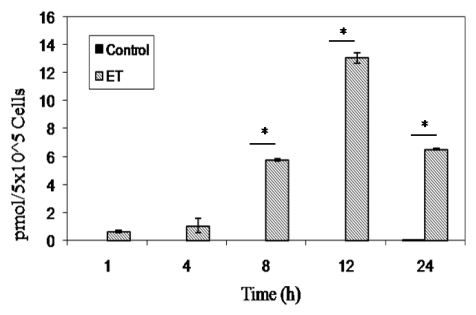
Figure 2.
cAMP production in ET-treated murine naïve B lymphocytes. 5 × 10⁵ naïve B lymphocytes in 200 μL were plated in each well of a 96 well tissue culture plate and treated with ET (2.5 μg/mL PA and 1.0 μg/mL EF) and intracellular cAMP was measured using a direct cAMP Enzyme Immunoassay kit according to manufacturer’s instructions (Assay Designs). Each bar represents the mean ± standard error of triplicate values. The data are from one experiment and are representative of three independent experiments. Asterisks denote a statistically significant difference between untreated and ET-treated cells (p < 0.05, ANOVA followed by the Student’s t-test).

