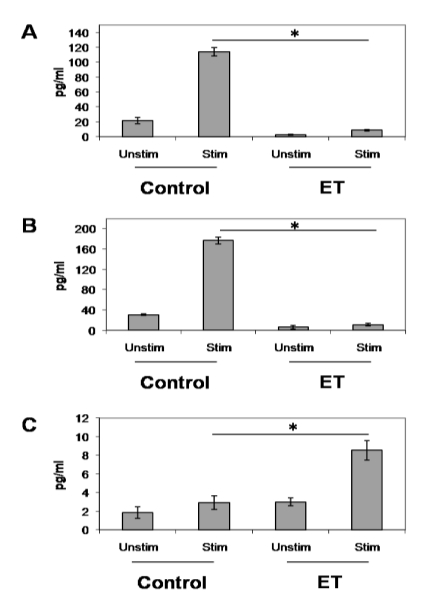
Figure 5.
ET’s effect on cytokine and chemokine production in stimulated B lymphocytes. 1 × 10⁶/mL naïve B lymphocytes from Balb/c mice were treated with ET (2.5 μg/mL PA and 1.0 μg/mL EF) for 4 h at 37 °C and 5% CO2. Cells were then stimulated with 5 µg/mL anti-CD40 antibody, 5 ng/mL IL-4 and 5 µg/mL anti-IgM antibody (eBioscience) for 48 h. After 48 h, supernatants were collected and levels of MIP-1α (a), MIP-1β (b) and IL-6 (c) were measured using a multi-plex cytokine array kit (Millipore). The data are expressed as means ± standard deviation of triplicate values and are representative of two independent experiments. Asterisks denote a statistically significant difference between untreated and ET-treated cells (p < 0.05 by ANOVA and Student’s t-test). Unstim—unstimulated; Stim—stimulated B cells.

