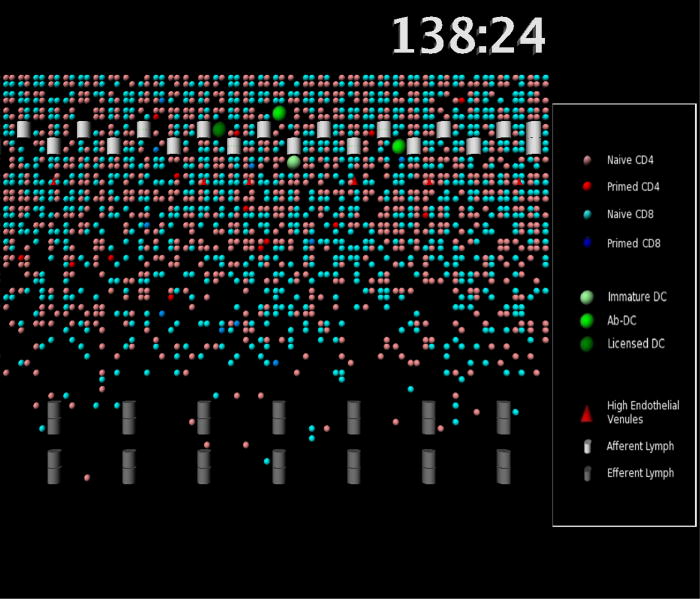
Figure 2.
Simulation snapshots. An enlarged view of a portion of the LN simulation grid is shown. High endothelial venules (red triangles), afferent lymphatics (white cylinders) and medullary sinuses (grey cylinders) are indicated; these are the entrance and exit ports for cells. Individual cells are shown as circles of various colors. See legend for details. 138:24 represents the time the snapshot was taken in hours and minutes.

