
Fig. 5.
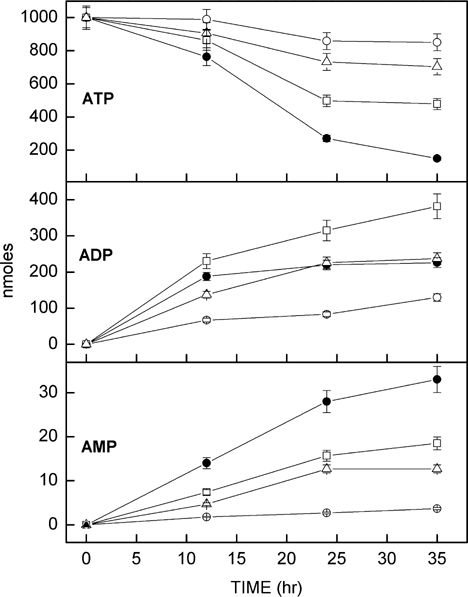
Amounts of hydrolyzed ATP and produced ADP and AMP by MVs: WT (•), TNAP-deficient (○), NPP1-deficient (□), and PHOSPHO1-deficient (Δ), monitored by HPLC analysis as described in “Materials and Methods.”
Official websites use .gov
A
.gov website belongs to an official
government organization in the United States.
Secure .gov websites use HTTPS
A lock (
) or https:// means you've safely
connected to the .gov website. Share sensitive
information only on official, secure websites.
Amounts of hydrolyzed ATP and produced ADP and AMP by MVs: WT (•), TNAP-deficient (○), NPP1-deficient (□), and PHOSPHO1-deficient (Δ), monitored by HPLC analysis as described in “Materials and Methods.”