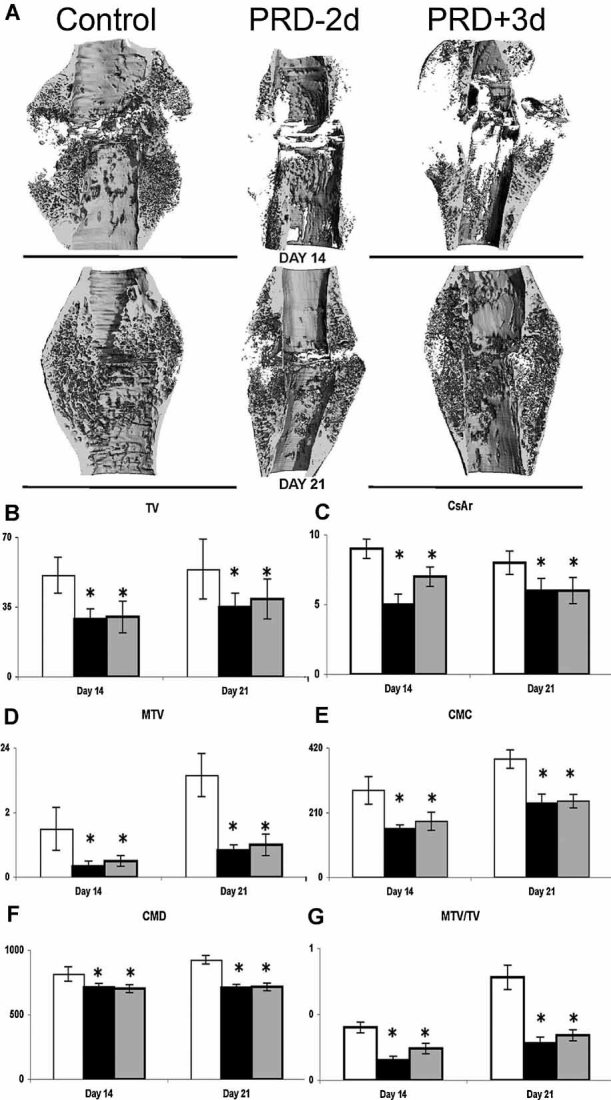
Fig. 2.

µCT analyses of callus formation. A. 3D µCT reconstructed images of fracture calluses of mice on the control and PRD diets at 14 days (upper panel) and 21 days (lower panel) after fracture. Data are representative of images obtained from 5 mice for each experimental condition. Quantitative µCT analyses of fracture healing 14 and 21 days after: (B) Total callus volume (TV). (C) Average callus cross-sectional area (CsAr). (D) Mineralized tissue volume (MTV). (E) Callus mineral content (CMC). (F) Callus mineral density (CMD). (G) Relative mineralized tissue volume (MTV/TV). White bars: Mice fed normal chow. Black bars: Mice placed on the PRD 2 days prior to fracture (PRD–2d). Gray bars: Mice placed on the PRD 3 days after fracture (PRD+3d). Data represent the mean and SD of values obtained from eight representative images of eight independent calluses that were used per treatment group and per time-point. *p < .005 versus controls.
