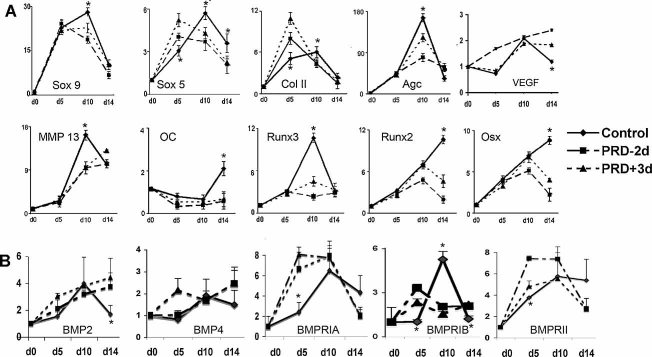
Fig. 5.
Quantitative RT-PCR analysis (A) Expression of mRNAs encoding markers and transcriptional regulators of chondrogenic and osteogenic differentiation was compared with that obtained from the adjacent unfractured bone. (B) Expression of mRNAs encoding BMP-2 and -4 and their receptors was compared with that obtained from the adjacent unfractured bone. mRNA levels from three calluses were compared with those from unfractured bones of mice fed the same diets. All data are normalized to β-actin levels in the same sample and presented as the fold change in expression relative to unfractured bone (d0). Data represents the mean ± S.D.

