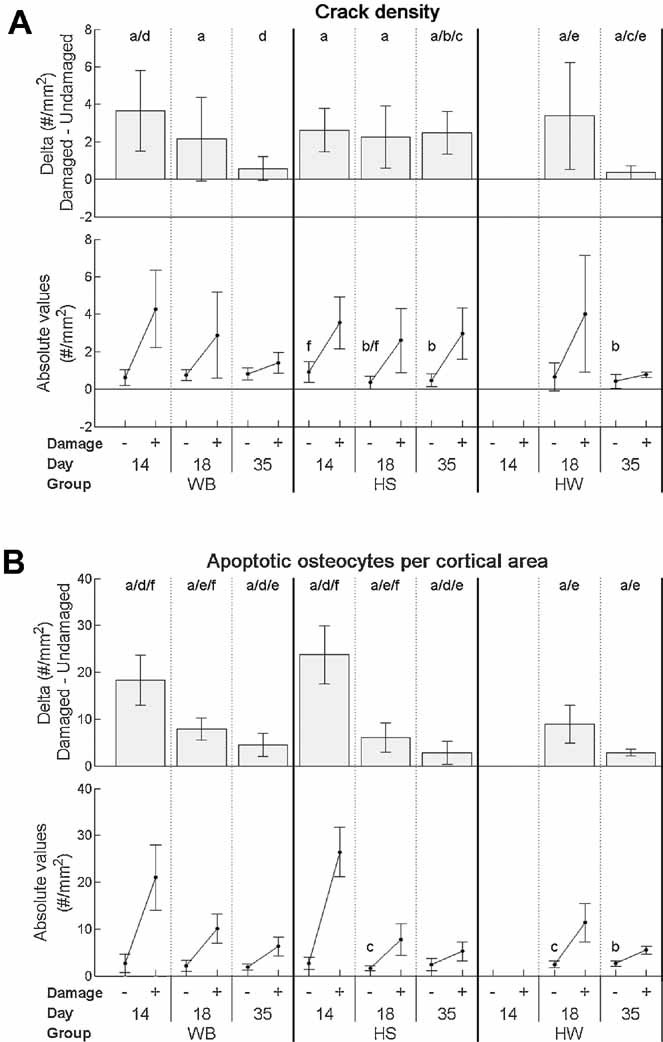
Fig. 2.

Microdamage parameters and associated osteocyte apoptosis for undamaged (–) and damaged (+) tibiae. (A) Crack density. Crack density was determined while omitting woven bone areas. Animals per group (WB/HS/HW): Day 14 (7/6/–), day 18 (7/8/7), day 35 (7/9/7). (B) Apoptotic osteocytes per cortical area. Number of apoptotic osteocytes (per cortical area) was determined while omitting woven bone areas. Animals per group (WB/HS/HW): Day 14 (6/7/–), day 18 (7/7/6), day 35 (7/8/6). Statistics: (a) Indicates significant difference between right versus left leg for that group on the particular day (i.e., Δ is significantly different from zero). (b) Indicates significant difference between WB and group on that day. (c) Indicates significant difference between HS and HW on that day. (d) Indicates significant difference between day 14 and day 35 within the specific group (WB, HS, or HW). (e) Indicates significant difference between days 18 and 35 within the specific group (WB, HS, or HW). (f) Indicates significant difference between days 14 and 18 within the specific group (WB, HS, or HW). Error bars indicate standard deviations.
