
Fig. 7.
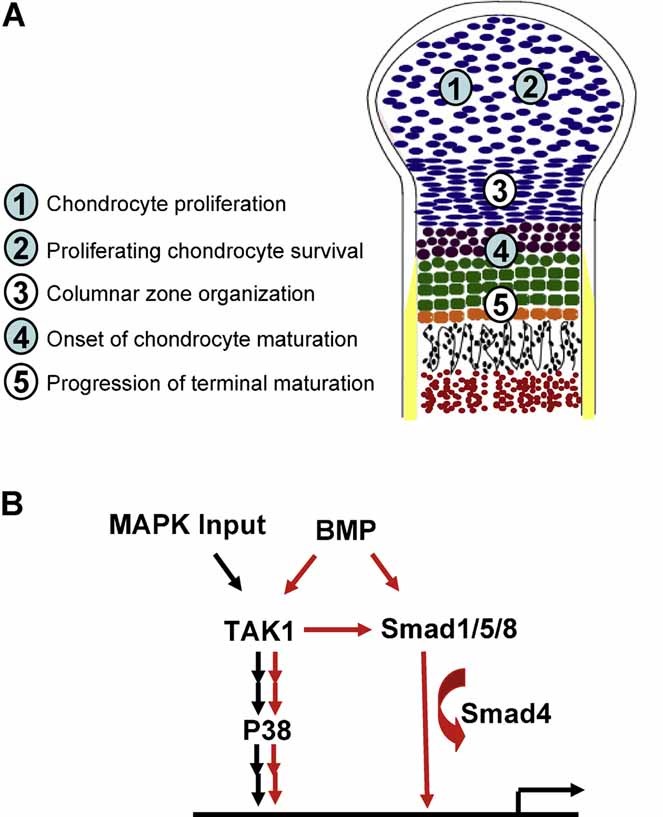
Summary of TAK1 signaling and regulation of cartilage development. (A) Cells are color coded as follows: Round blue cells are immature/slowly proliferating chondocytes; flat blue cells are columnar, highly proliferative chondrocytes; purple cells are prehypertrophic chondrocytes; green cells are hypertrophic chondrocytes; orange cells indicate terminally hypertrophic chondrocytes; black cells indicate trabecular osteoblasts; red cells indicate bone marrow; and the yellow area indicates maturing bone collar. Numbers in light blue circles indicate chondrocyte-specific effects of TAK1, and numbers in white circles are perichondrial effects of TAK1. (B) TAK1 signaling via the MAPK and BMP pathways. Red arrows indicate canonical and noncanonical BMP signaling regulation; black arrows indicate MAPK signaling via TAK1.