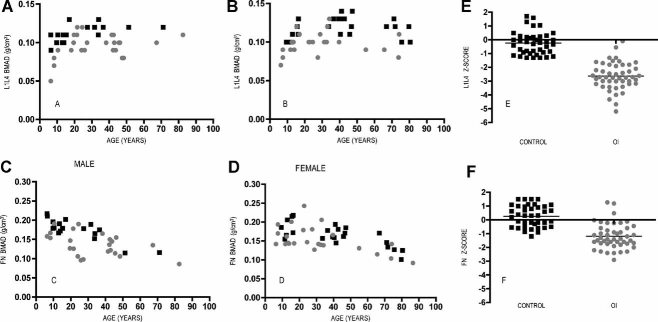
Fig. 3.
OOA kindred bone mineral density (DXA) measurements. The principal quantitative measure of phenotype severity was aBMD using DXA. BMAD was calculated from L1–4 spine (A, B) and femoral neck (C, D) DXA aBMD measurements as an estimate of volumetric bone density. Both male (left) and female (center) T allele individuals (OI) tended to have reduced BMAD compared with family controls as a function of age. Mean Z-scores using Hologic normative date are reduced in OI family members as compared with controls in both the spine (E) and hip (F).

