
Fig. 2.
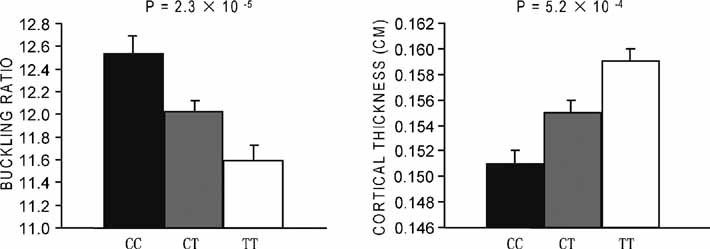
Least square means (± SE) of BR and CT values in the three genotypes of SNP rs7430431 in the unrelated GWAS Caucasian subjects. A linear regression model was used with age, age2, sex, age/age2-by-sex interaction, height, and weight as covariates. P values of one-way ANOVA for testing the genotype effects on adjusted BR and CT are given.