
Fig. 1.
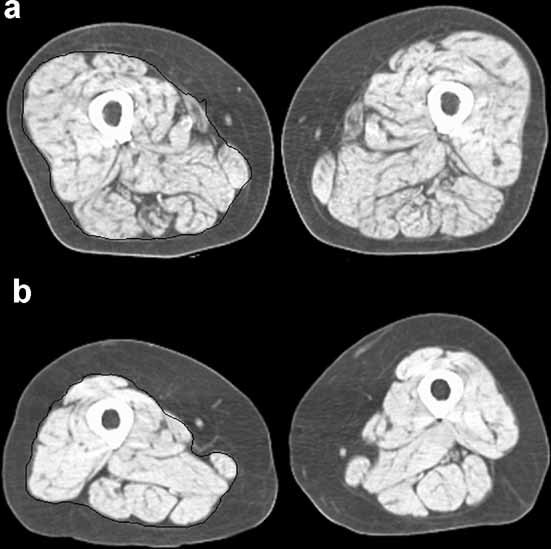
Representative CT images of the midthigh showing in black the outline of the region of interest encompassing the thigh muscle bundle used for area and attenuation measurements in this study. (a) Axial image showing extensive fatty infiltration of the muscle and having a thigh muscle lean tissue attenuation coefficient of 26 HU. (b) Axial image with a thigh muscle lean tissue attenuation coefficient of 38.6 HU.