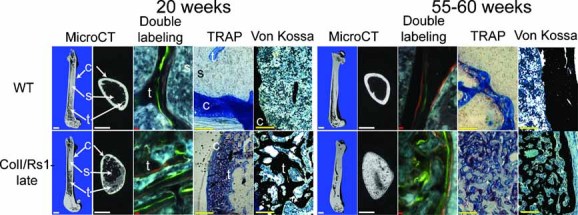
Fig. 6.

Representative µCT images of femora in longitudinal and transverse mid-diaphysis sections of age- and sex-matched mice show a delayed but gradual increase in trabecular bone and loss of cortical bone in the ColI/Rs1-late mice. Scale bar = 1 mm. Double fluorochrome labeling (middle panels) with calcein (green) and xylenol orange (orange) demonstrated disordered bone formation in the areas of increased trabecular bone. Scale bar = 10 µm. TRAP staining (pink), indicative of osteoclast-lineage cells, is increased within the regions of expanded trabecular bone in ColI/Rs1-late mice. Scale bar = 100 µm. Von Kossa staining shows the increased trabecular bone and loss of normal bone marrow cells (scale bar = 100 µm). c = cortical bone; t = trabecular bone; s = bone marrow space.
