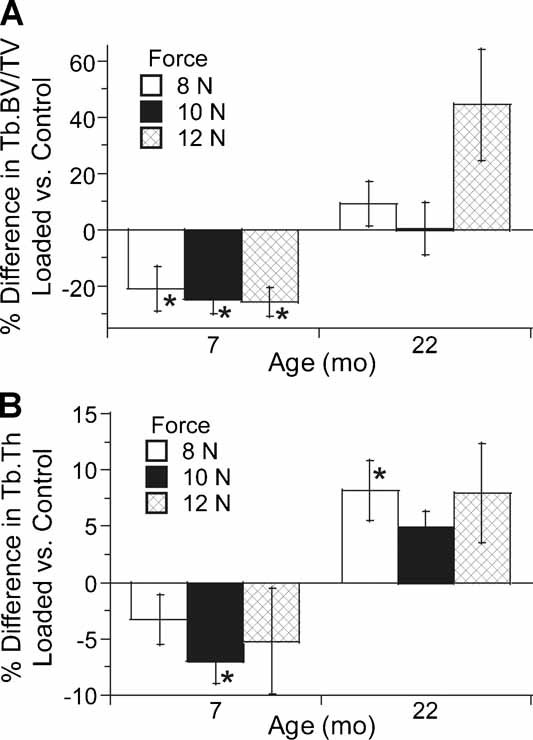
Fig. 4.

Differences in (A) trabecular bone volume fraction and (B) trabecular thickness between loaded and control tibias determined by postmortem µCT of the proximal tibia (study 1) (mean ± SE). In 7-month-old mice, BV/TV was approximately 25% less in loaded tibias than controls, whereas Tb.Th was 5% less (p < .01 by ANOVA). In 22-month-old mice, by contrast, BV/TV did not differ between loaded and control tibias (p = .55), whereas Tb.Th was approximately 7% greater in loaded tibias (p < .001). *Loaded different from control; p < .05, paired t test.
