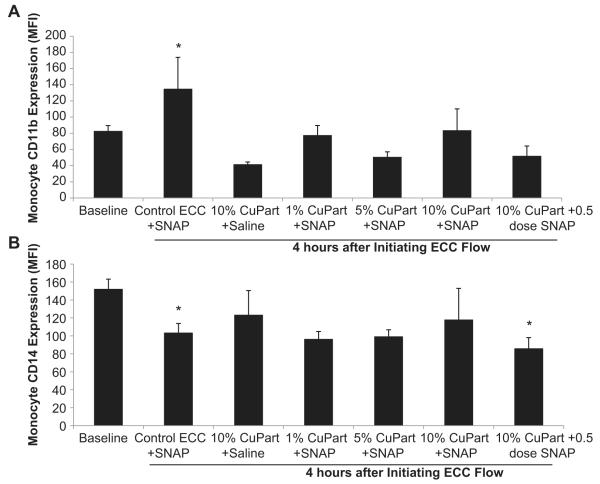
Fig. 9.
Fluorescent-activated cell sorting (FACS) analysis for circulating monocytes after 4 h blood exposure with NOGen or control polymer-coated ECCs with or without exogenous SNAP infusion. (A), Monocyte CD11b mean fluorescence intensity (MFI) after 4 h on ECC in NOGen and control polymers. (B) Monocyte CD14 (monocyte specific marker) mean fluorescence intensity (MFI) after 4 h on ECC in NOGen and control polymers. The data are means ± SEM. * = p < 0.05, baseline vs control ECC or NOGen ECCs. The specific MFI data is after the isotype control value was subtracted from each CD11b or CD14 MFI value. All FACS analyses used the gated FSC/SSC plot for monocytes and 100 μl of whole rabbit blood was used for each determination.

