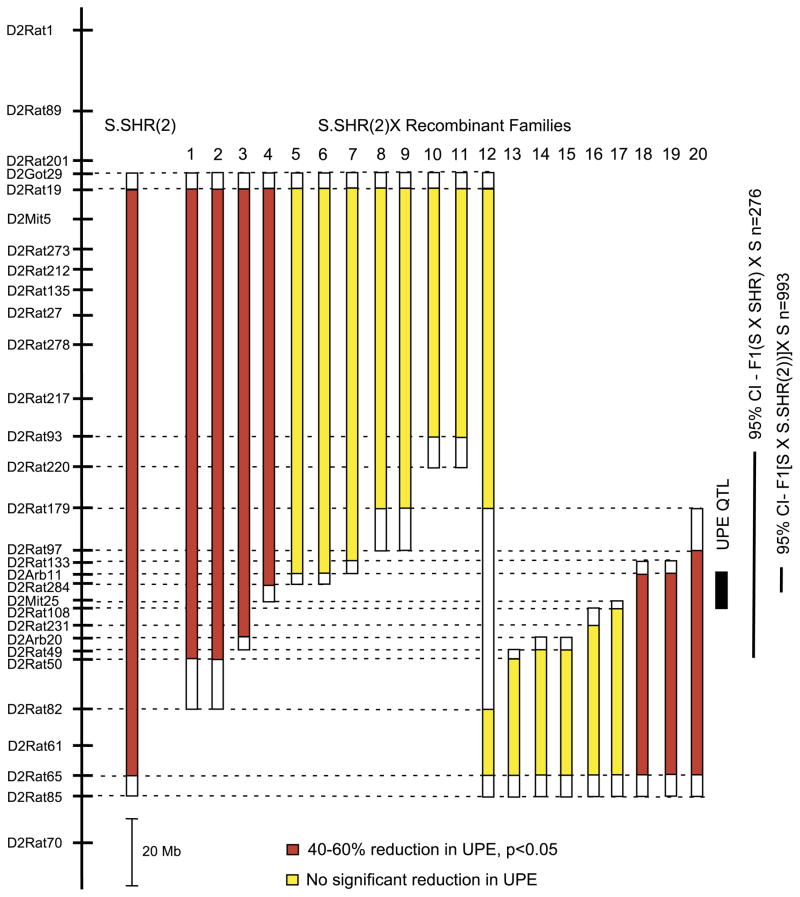
Fig. 4.
Fine mapping of renal function quantitative trait loci (QTL) using recombinant progeny testing (RPT). The physical map of rat chromosome 2 is shown on the left. The solid bars to the right of the physical map indicate the extent of the SHR-donor regions for each recombinant family. The open region represents the recombination interval. UPE was measured at week 6. The solid black bar denotes the location of the QTL based on the RPT. The 95% confidence interval (CI) obtained from the original linkage analysis (20) and the present study is shown to the right of the figure. Red bars denote that recombinant animals (congenic-like) had significantly (P < 0.05) lower UPE compared with nonrecombinant (S-like) littermates. Yellow bars denote there was not a significant difference in UPE between recombinant and nonrecombinant littermates. The number of animals tested from each recombinant family ranged from 16 to 29.

